The difference between useful monitoring and dashboard wallpaper is which metrics you track and how you interpret them. Most teams either track too little (uptime only — “it’s up, ship it”) or too much (500 metrics, zero insights). This guide covers the 12 metrics that matter, organized from infrastructure fundamentals to business outcomes.
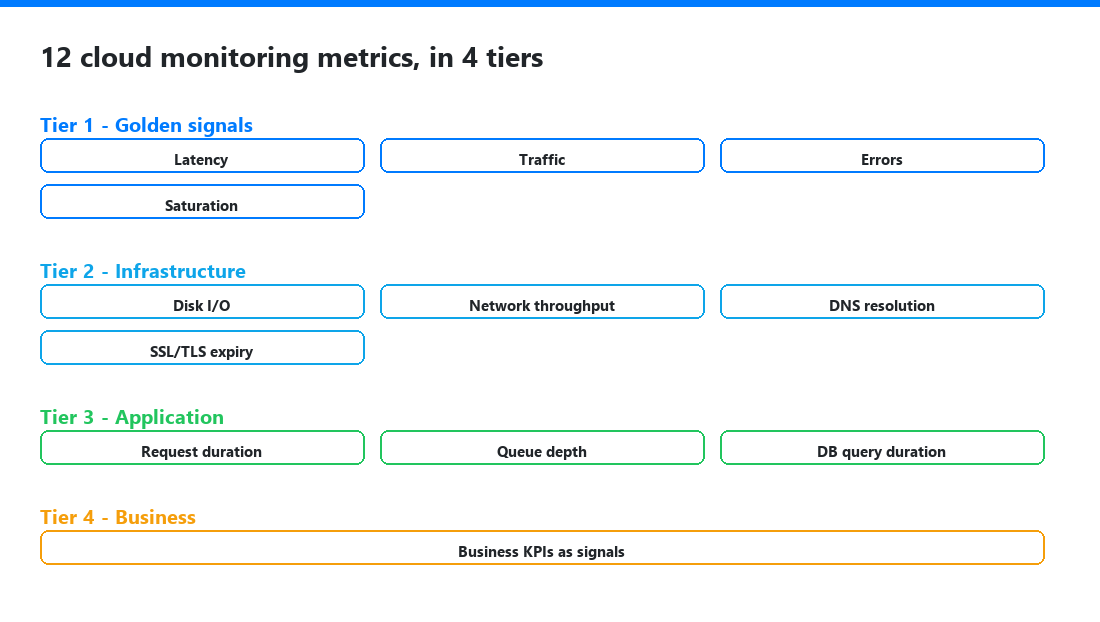
Tier 1 — The four golden signals
Google’s SRE handbook distilled operational wisdom into four metrics every service needs. Start here, and you’ll catch the majority of real-world problems.
1. Latency (response time)
What: How long requests take to serve — measured as p50 (median), p95 and p99 percentiles.
Why p95/p99, not average: An average of 200 ms hides that 5% of users are experiencing 3-second loads. Percentiles show the tail — which is where your worst user experiences (and your biggest customers’ requests) live.
Alert on: p95 > 2× your baseline for 5+ minutes. A brief spike is normal; sustained degradation is an incident.
2. Traffic (throughput)
What: The volume of demand — requests per second, transactions per minute, messages processed per second.
Why it matters: Traffic is context for everything else. A latency spike during 10× normal traffic is a capacity issue. The same spike at normal traffic is a bug. Traffic drops can signal upstream failures (a load balancer issue, a DNS problem) that uptime checks alone might miss.
Alert on: sudden drops (> 50% below baseline) — this often catches outages faster than error rate.
3. Errors (failure rate)
What: The fraction of requests that fail — 5xx HTTP errors, application exceptions, timeout rates.
Alert on: error rate > 1% for 5+ minutes (adjust to your baseline). Distinguish between client errors (4xx — usually not your problem) and server errors (5xx — always your problem).
4. Saturation (resource utilization)
What: How “full” your resources are — CPU utilization, memory usage, disk capacity, I/O wait, network bandwidth.
Why it matters: Saturation is a leading indicator — performance degrades before resources hit 100%. CPU at 85% for an hour suggests you’ll hit capacity soon; disk at 92% means you have days, not weeks.
Alert on: CPU > 80% sustained (15+ min), memory > 85%, disk > 85%. These thresholds vary by workload — a CPU-bound batch job at 95% is fine; a web server at 95% is about to drop requests.
Tier 2 — Infrastructure KPIs
These extend the golden signals with specific infrastructure metrics that surface common failure modes.
5. Disk I/O latency and throughput
High I/O wait means the CPU is idle waiting for disk — a common bottleneck that doesn’t show up in CPU utilization. Track read/write IOPS and I/O latency. Alert on sustained I/O latency > 10 ms for SSDs, > 50 ms for spinning disks.
6. Network throughput and packet loss
Bandwidth saturation and packet loss cause latency spikes and timeouts that look like application bugs. Track bytes in/out per interface and packet loss percentage. Especially critical in multi-AZ and cross-region architectures where network is the weakest link.
7. DNS resolution time
A slow or failing DNS resolver adds latency to every outbound request your application makes. Often overlooked because it’s “infrastructure” — but a 500 ms DNS resolution penalty on every API call to a third-party service compounds into visible user-facing latency. Monitor resolution time from inside your application, not just externally.
8. SSL/TLS certificate expiry
Not a real-time metric, but the most preventable outage type. An expired certificate on a checkout subdomain causes a conversion catastrophe with a known date. Alert at 30, 14 and 7 days. Every uptime monitoring tool includes this — turning it on takes one minute.
Tier 3 — Application metrics
Infrastructure metrics tell you resources are stressed. Application metrics tell you users are affected.
9. Request duration by endpoint
The golden signal “latency” is service-wide. Endpoint-level duration reveals which API or page is slow. A single slow endpoint (the search query, the checkout call) can degrade the entire user experience while the service-wide p95 looks fine.
10. Queue depth and processing lag
If your architecture includes message queues (SQS, Kafka, RabbitMQ), queue depth is a saturation signal for your workers. A growing queue means consumers can’t keep up — either the workload spiked or a consumer is stuck. Alert on queue depth growing continuously for 10+ minutes.
11. Database query duration
Slow queries are the #1 cause of application latency. Track p95 query duration and query volume. A query that ran in 5 ms at 100 QPS may take 500 ms at 10,000 QPS — the performance cliff is often sharper than linear.
Tier 4 — Business metrics
The metrics everything else exists to protect.
12. Business KPIs as monitoring signals
- Revenue per minute — for e-commerce, this is the ultimate monitoring metric. A drop correlates directly with checkout failures or performance degradation.
- Conversion rate — a leading indicator of user experience problems that don’t surface as errors. A 10% conversion drop with zero 5xx errors means something functionally broke.
- Active users / sessions — a sudden drop signals an outage or severe degradation even before error metrics react.
These aren’t metrics your monitoring tool collects automatically — they come from your analytics, payment processor or application database. The practice of piping business metrics into your monitoring dashboard closes the gap between “the servers are fine” and “revenue is down.”
How to use these metrics together
The diagnostic ladder:
- Business metric drops (conversion rate, active users) → something is wrong, users are affected.
- Application metrics confirm (error rate up, request duration up) → the problem is in the application layer.
- Infrastructure metrics localize (CPU saturated, disk I/O spiked, database query duration up) → the root cause is here.
Work top-down during incidents (start with what users see, not what servers report). Build dashboards bottom-up (infrastructure → application → business). Alert on the level that catches the problem fastest without false positives — for most teams, that’s error rate and p95 latency.
Bottom line
Track the four golden signals on every service — that baseline catches most operational problems. Add the infrastructure and application metrics specific to your failure modes as debugging reveals blind spots. Wire in business metrics to connect technical health to the numbers that pay for the infrastructure. The goal is 10–15 metrics you actually look at, not 500 that nobody reads. Set them up in your monitoring platform and build the alerting that turns thresholds into action.